Placements per Recruiter: The Math Behind Staffing Growth
—— Read time: 7 min
The short answer
In staffing, recruiters are the P&L, so placements per recruiter decides how fast a firm grows. Yet most recruiters spend about a third of the week sourcing and only about 28% of their time on actual recruiting work. Give part of that time back, and the same desks place more.
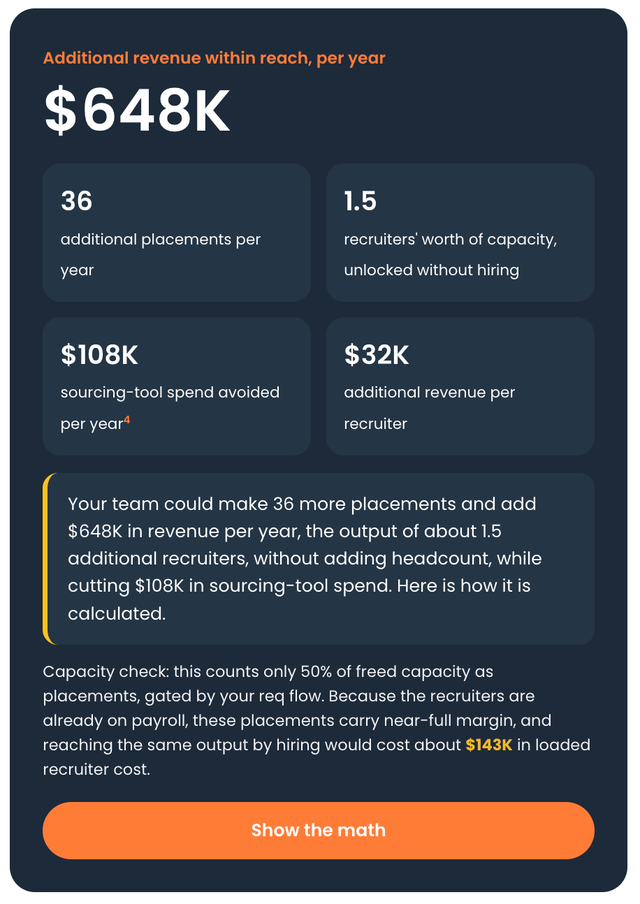
The math is one line: recruiters × placements each × productivity lift × demand capture × revenue per placement. For example, at conservative settings, a 20-desk perm team placing 24 a year each adds about 36 placements, or roughly $648,000 a year, without hiring a single recruiter.
Why placements per recruiter is the number that matters
A staffing firm has no product but placements, and no placement without recruiter capacity. That makes placements per recruiter the cleanest measure of growth: revenue per head, without adding heads.
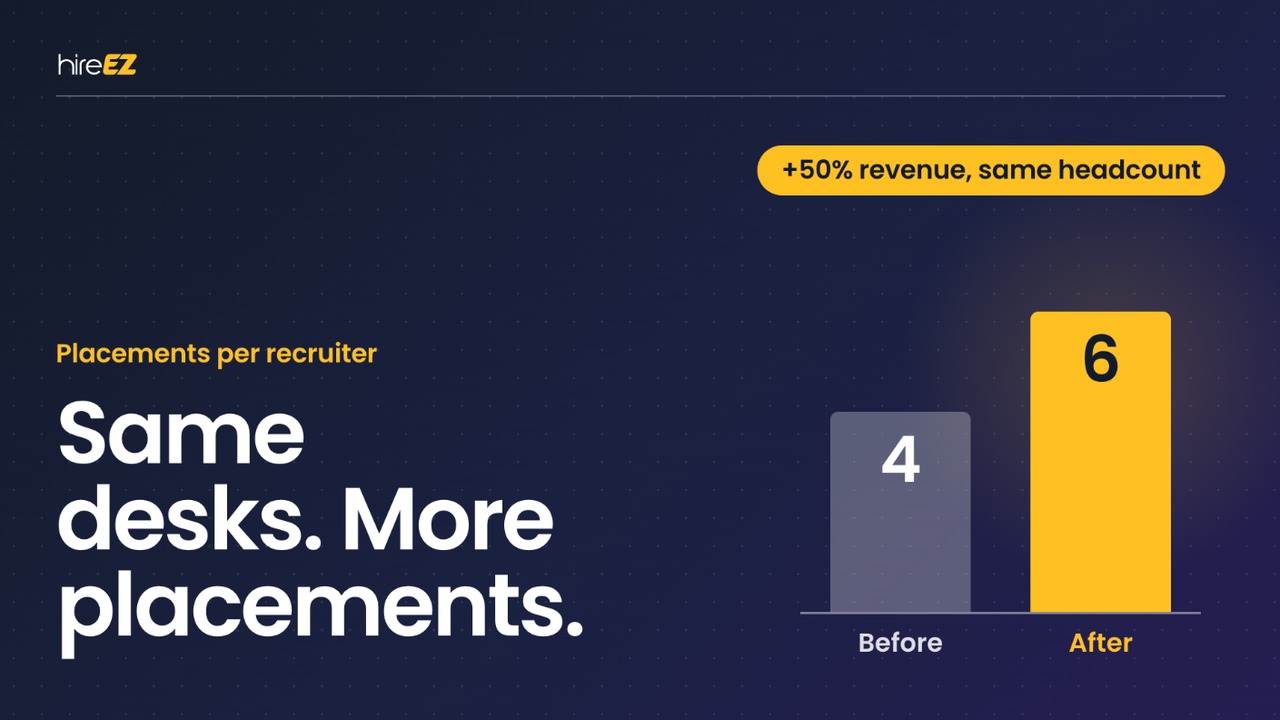
The leverage is bigger than it looks. A firm with 50 recruiters that moves each desk from four placements a month to six hasn't improved a productivity metric. It has grown revenue by 50% on the same headcount.
The constraint is time. The recruiter time studies cited in hireEZ's staffing calculator find that recruiters spend:
About 13 hours a week sourcing per role, roughly a third of a standard week.
About 22% of their time reviewing resumes.
Only about 28% of their time on actual recruiting work, with about 52% going to administration, in a two-week study of 200+ recruiters across 20 companies.
The market is rewarding firms that fix this. Bullhorn's 2026 GRID Industry Trends Report found that agencies adopting AI are about twice as likely to grow revenue as those that aren't.
The math, in three levers
The calculator models placements directly, and treats speed and tool spend as the reasons the gain compounds.
Lever 1: Capacity to placements
Automating sourcing and screening returns time to closing, so the same desks place more:
Additional revenue = recruiters × placements each × productivity lift × demand capture × revenue per placement
Demand capture is the honesty control. Freed time only becomes a placement when there's a req to fill, so the model counts only the share of freed capacity your req flow and client demand can absorb. The calculator's conservative default is 50%.
Lever 2: Velocity wins reqs
In contingent and split markets, the first firm to submit qualified, interested candidates usually wins. Faster sourcing raises your win rate on the reqs you already work and fits more placement cycles into the year, with no new business development.
Faster sourcing → higher win rate on existing reqs + more cycles per desk
Lever 3: Tool spend to margin
Sourcing across many platforms and resurfacing your own database reduces dependence on per-seat sourcing tools. That saving drops straight to margin, with no revenue assumptions at all.
For perm desks, revenue per placement is the one-time fee. For contract desks, it's the margin per contractor placed.
A worked example at conservative settings
A 20-desk perm team, using the calculator's conservative settings:
Input
Value
Where it comes from
Recruiters (billing desks)
20
Illustrative; use your own
Placements per recruiter per year
24
Illustrative; use your own
Revenue per placement
$18,000
Calculator default: about a 20% fee on a $90,000 first-year salary
Productivity lift
15%
Calculator's conservative setting, below hireEZ's measured range
Demand capture
50%
Calculator's conservative default
20 × 24 × 15% × 50% = 36 additional placements a year. At $18,000 each, that's about $648,000 in additional revenue, or about $32,400 more per recruiter. It's the output of 1.5 extra recruiters, unlocked without hiring. Reaching the same output by hiring would cost about $143,000 in loaded recruiter cost, at the calculator's default of $95,000 per recruiter.
The margin floor adds to that. With one sourcing-tool seat per recruiter at the calculator's default of $10,800 a year, cutting that spend by 50% (the low end of the 50–60% LinkedIn seat-spend reduction hireEZ customers report) saves 20 × $10,800 × 50% = $108,000 a year, before any revenue gain.
These are directional estimates at default inputs. Replace each one with your own numbers.
Where the hours come back
The gain doesn't come from working harder. It comes from moving the repeatable parts of the desk off the recruiter's plate:
Sourcing. Searching many platforms at once, instead of one network at a time, finds more qualified candidates faster. A single network also caps response: InMail response rates run only about 10–25%.
Your own database. Candidates you already paid to acquire sit in your ATS. Resurfacing them is often the fastest path to a submittal.
Screening. Automating screening is documented to cut recruiter time per hire by 60–70%, with recruiters reviewing the results.
Scheduling and follow-up. Automated scheduling and outreach remove the back-and-forth that eats the rest of the week.
Speed to submit. All of it compounds on contingent desks, where the first qualified, interested candidate usually wins the placement.
Time returned to closing, client calls and candidate relationships is the time that turns into placements.
Making the case to your CEO or board
Staffing owners, CEOs and PE operating partners think in revenue per recruiter, margin per placement and pipeline velocity. Frame the case in those terms:
Lead with placements, not hours. "36 more placements a year" lands; "recruiters save 13 hours a week" doesn't.
Show the demand constraint up front. State the demand-capture rate you used, and why. It answers the first objection before anyone raises it.
Choose the path: growth or cost. The same freed capacity can fund more placements with the same team, or the same output with fewer seats. Model the one your plan needs.
Separate hard savings from revenue. Present tool-spend savings as the floor and added revenue as upside, so the case holds even if demand softens.
Commit to measuring it. Agree on a baseline (placements per recruiter, time to submit and fill rate), then measure the real change from your own data within 90 days.
For RPO teams, the same logic runs one level up: show each client the gain in your QBR.
See it in action: from your numbers to more placements
1. Run your own numbers. Enter your recruiters, placements per recruiter and average fee, then select Show the math to see every line, including the demand-capture rate. Here's the worked example above, entered in the calculator:
2. Give the hours back. hireEZ works on top of the ATS your firm already runs, with 40+ native integrations:
Source wider. Search 1B+ profiles across 45+ platforms and surface about 7x more qualified talent.
Start with your own database. Resurface 2.5x more candidates you already have.
Screen and engage at scale. Voice AI screens and engages candidates around the clock, and customers see a 38% higher response rate.
Schedule automatically. The AI Scheduler syncs calendars and books interviews.
Cut seat spend. Customers report a 50–60% reduction in LinkedIn seat spend.
Keep RPO clients separate. Multi-tenant workspaces keep each client's data in its own environment.
3. Prove it. hireEZ customers report recruiter-productivity gains of up to 45%, depending on how productivity is measured. Teams deploy in weeks and prove value in 90 days, and analytics measures your actual change in sourcing time, fill rate and time-to-fill from your own data.
It's the number of placements a staffing firm makes in a period, divided by its billing recruiters. Because recruiters are a staffing firm's main capacity, it's the clearest measure of revenue per head.
How can a staffing firm increase placements per recruiter without hiring?
Give recruiters back the time they spend on manual sourcing, screening and scheduling, and resurface candidates already in your ATS. The freed time becomes placements when there's client demand to absorb it.
Does more recruiter capacity always mean more placements?
No. Freed time only turns into a placement when there's a req to fill. That's why hireEZ's staffing calculator multiplies every revenue line by a demand-capture rate, with a conservative default of 50%.
How much time do recruiters spend sourcing?
Time studies cited in hireEZ's staffing calculator put it at about 13 hours a week per role, roughly a third of a standard week, with only about 28% of recruiter time going to actual recruiting work.
Can AI help a staffing agency grow revenue?
Bullhorn's 2026 GRID Industry Trends Report found that agencies adopting AI are about twice as likely to grow revenue as those that aren't.